 Nomography, truly a forgotten art, is the graphical representation of mathematical relationships or laws (the Greek word for law is nomos). These graphs are variously called nomograms (the term used here), nomographs, alignment charts, and abacs. This area of practical and theoretical mathematics was invented in 1880 by Philbert Maurice d’Ocagne (1862-1938) and used extensively for many years to provide engineers with fast graphical calculations of complicated formulas to a practical precision.
Along with the mathematics involved, a great deal of ingenuity went into the design of these nomograms to increase their utility as well as their precision. Many books were written on nomography and then driven out of print with the spread of computers and calculators, and it can be difficult to find these books today even in libraries. Every once in a while a nomogram appears in a modern setting, and it seems odd and strangely old-fashioned—the multi-faceted Smith Chart for transmission line calculations is still sometimes observed in the wild. The theory of nomograms “draws on every aspect of analytic, descriptive, and projective geometries, the several fields of algebra, and other mathematical fields” [Douglass].
This essay is an overview of how nomograms work and how they are constructed from scratch. Part I of this essay is concerned with straight-scale designs, Part II additionally addresses nomograms having one or more curved scales, and Part III describes how nomograms can be transformed into different shapes, the status of nomograms today, and the nomographic references I consulted.
 The simplest form of nomogram is a scale such as a Fahrenheit vs. Celsius scale seen on an analog thermometer or a conversion chart. Linear spacing can be replaced with logarithmic spacing to handle conversions involving powers. Slide rules also technically qualify as nomograms but are not considered here. A slide rule is designed to provide basic arithmetic operations so it can solve a wide variety of equations with a sequence of steps, while the traditional nomogram is designed to solve a specific equation in one step. It’s interesting to note that the nomogram has outlived the slide rule.
Most of the nomograms presented here are the classic forms consisting of three or more straight or curved scales, each representing a function of a single variable appearing in an equation. A straightedge, called an index line or isopleth, is placed across these scales at known values of these variables, and the value of an unknown variable is found at the point crossed on that scale. This provides an analog means of calculating the solution of an equation involving one unknown, and for finding one variable in terms of two others it is much easier than trying to read a 3-D surface plot. We will see later that it is sometimes possible to overlay scales so the number of scale lines can be reduced.
The Geometry of Nomograms
We can design nomograms composed of straight scales by analyzing their geometric properties, and a variety of interesting nomograms can be constructed from these derivations. Certainly these seem to be the most prevalent types of nomograms.
The figure on the right shows the basic parallel scale nomogram for calculating a value f3( w) as the sum of two functions f1(u) and f2(v):
f1(u) + f2(v) = f3( w)
Each function plotted on a vertical scale using a corresponding scaling factor (sometimes called a scale modulus) m1, m2 or m3 that provides a conveniently sized nomogram. The spacing of the lines is shown here as a and b. Now by similar triangles, [m1f1(u) – m3f3( w)] / a = [m3f3( w) – m2f2(v)] / b. This can be rearranged as:
m1f1(u) + (a/b) m2f2(v) = (1 + a/b) m3f3( w)
So to arrive at the original equation f1(u) + f2(v) = f3( w), we have to cancel out all the terms involving m, a and b, which is accomplished by setting m1 = (a/b) m2 = (1 + a/b)m3. The left half of this relationship provides the relative scaling of the two outer scales and the outer parts provide the scaling of the middle scale:
m1/ m2 = a / b m3 = m1m2 / (m1+ m2)
Also note that the baseline does not have to be perpendicular to the scales for the similar triangle proportion to be valid. Now a = b for the case where the middle scale is located halfway between the outer scales, and in this case m1 = m2 and m3 = ½m1. For a smaller range and greater accuracy of an outer scale, we can change its scale m and move the middle line away from it and toward the other outer scale. In fact, if the unknown scale w has a very small range it can be moved outside the two other scales to widen the scale.  Additions to u, v or w simply shift the scale values up or down. Multipliers of u, v and w multiply the value when drawing the scales (they are not included in the values of m in the above calculations). Subtracting a value simply reverses the up/down direction of the scale, and if two values are negative their scales can simply be swapped. The example on the right shows a parallel-scale nomogram for the equation (u–425) – 2(v–120) = w designed for ranges 530<u<590 and 120<v<180.
So this looks like a lot of work to solve a simple linear equation. But in fact plotting logarithmic rather than linear scales expands the use of parallel scale nomograms to very complicated equations! The use of logarithms allows multiplications to be represented by additions and powers to be represented by multiplications according to the following rules:
log(cd) = log c + log d log cd = d log c
So if we have an equation such as f1(u) x f2(v) = f3( w), we can replace it with
log [f1(u) x f2(v)] = log f3( w)
or
log f1(u) + log f2(v) = log f3( w)
and we have converted the original equation into one without multiplication of variables. And note that there is actually no need to solve symbolically for the variable (we just plot these logs on the scales), a significant advantage when we come to more complicated equations.
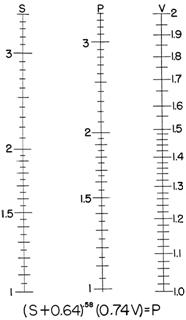
Let’s create a nomogram for the engineering equation (u + 0.64)0.58(0.74v) = w as given in Douglass. We assume that the engineering ranges we are interested in are 1.0<u<3.5 and 1.0<v<2.0.
0.58 log (u + 0.64) + log (0.74v) = log w
0.58 log (u + 0.64) + log (0.74) + log v = log w
0.58 log (u + 0.64) + log v = log w – log (0.74)
 We will directly plot the three components here as our u, v and w scales. To find the scaling factors we divide the final desired height of the u and v scales (say, 6 inches for both) by the ranges (maximum – minimum) of u and v:
m1 = 6 / [0.58 log (3.5 + 0.64) – 0.58 log (1 + 0.64) ] = 25.72
m2 = 6 / [log 2.0 – log 1.0] = 19.93
m3 = m1m2 / (m1+ m2) = 11.23
Let’s set the width of the chart to 3 inches:
a / b = m1 / m2 = 1.29 so a = 1.29b
a + b = 3 so 1.29b + b = 3 yielding b = 1.31 inches and a = 1.69 inches
We draw the u-scale on the left marked off from u = 1.0 to u = 3.5. To do this we mark a baseline value of 1.0 and place tick marks spaced out as 25.72 [0.58 log (u + 0.64) – 0.58 log (1.0 – 0.64)] which will result in a 6 inch high line. Then 3 inches to the right of it we draw the v-scale with a baseline value of 1.0 and tick marks spaced out as 19.93 (log v – log 1). Finally, 1.69 inches to the right of the u-scale we draw the w-scale with a baseline of (1.0 + 0.64)0.58(0.74)(1) = 0.98 and tick marks spaced out as 11.23 (log w – log 0.74).  And we arrive at the nomogram on the right, where a straightedge connecting values of u and v crosses the middle scale at the correct solution for w, and in fact any two of the variables will generate the third. Flexibility in arranging terms of the equation into different scales provides a means of optimizing the ranges and accuracies of the nomogram. A larger scale and finer tick marks can produce a quite accurate parallel scale nomogram that is deceptively simple in appearance, and one that can be manufactured and re-used indefinitely for this engineering equation.
It is also possible to create a circular nomogram to solve a 3-variable equation. Details on doing this from geometrical derivations are given in Douglass.
N or Z Charts
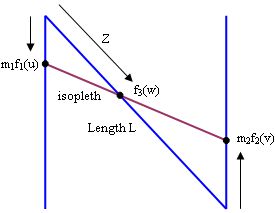 A nomogram like that shown in the figure on the right is called an “N Chart” or more commonly a “Z Chart” because of its shape. The slanting middle scale joins the baseline values of the two outer scales (which are now plotted in opposition). The middle line can slant in either direction by flipping the diagram, and it can be just a partial section anchored at one end or floating in the middle if the entire scale isn’t needed in the problem, thus appearing, as Douglass puts it, “rather more spectacular” to the casual observer. A Z chart can be used to solve a 3-variable equation involving a division:
f3( w) = f1(u) / f2(v)
By similar triangles, m1f1(u) / m2f2(v) = Z / [L – Z]. Substituting f3( w) for f1(u) / f2(v) and rearranging terms yields the distance along Z for tick marks corresponding to f3( w):
Z = L f3( w) / [(m2/m1) + f3( w)]
 The f3( w) scale does not have a uniform scaling factor m3 as before. We could have used a parallel scale chart with logarithmic scales to plot this division, but the Z chart performs this with linear scales for u and v and it was once a real chore to calculate logarithms. But further, the linear scales of the Z Chart are much more suitable for combining a division with an addition or subtraction than compound parallel scales with their logarithmic scales. And of course if the scale for the unknown variable is an outside one, we have a Z chart for multiplication.
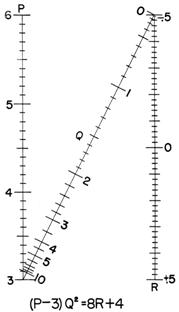
An example of a Z chart is shown here for the equation Q2 = (8R+4) / (P-3). To create this, the desired height of the nomogram and the ranges of P and R provide their scaling factors m1 and m2 as done earlier. The desired width of the chart along with this height defines the length L needed for the Q-scale (L2 = W2 + H2). The tick marks for Q are located a distance from the end calculated from the formula for Z above, where f3( w) is replaced with Q2. It is also possible to slide the outer scales up or down without changing the tick mark spacing of the Z-scale as it also rotates due to its endpoints (because similar triangles still result), yielding in a nomogram with a perpendicular Z-scale as shown in an example in the second part of this essay.
Proportional Charts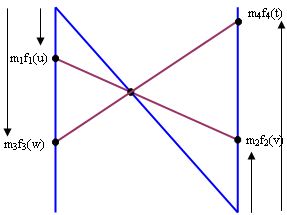
The proportional chart solves an equation in four unknowns of the type
f1(u) / f2(v) = f3( w) / f4(t)
If we take our Z chart diagram and a second isopleth that intersects the Z line at the same point as the first, we have by similar triangles:
m1f1(u) / m2f2(v) = m3f3( w) / m4f4(t)
which matches our equation above if we choose the scaling of the outer scales such that
m1 / m2 = m3 / m4
We then overlay two variables on each outer scale with this ratio of scaling factors, as shown in the nomogram to the right from Josephs for the approximate pitch of flange rivets in a plate girder, where p is the rivet pitch in inches, R is the rivet value in lbs, h is the effective depth of the girder in inches, and V is the total vertical shear in lbs: p = Rh/V.
Another type of proportional chart uses crossed lines within a boxed area, as shown below. Again, the scaling factors for the four variables are given by m1 / m2 = m3 / m4 where these are related as before to the u, v, w and t scales, respectively. (Actually, similar triangles still exist and the ratios still hold for any parallelogram, not just a rectangle.)


But there are other types of proportional charts as shown below. In the ones labeled Type 3 an isopleth is drawn between two scale variables, then moved parallel until it spans the third variable value and the fourth unknown variable. The flange rivet example done in this manner is shown here. In the Type 4 nomogram the second isopleth is drawn perpendicular rather than parallel to the first one; it’s actually easier to draw a perpendicular than a parallel line if you have a drafting square or even a rectangular sheet of paper.


Concurrent Scale Charts
 The concurrent chart solves an equation of the type
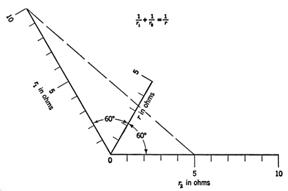
1/f1(u) + 1/f2(v) = 1/f3( w)
The effective resistance of two parallel resistors is given by this equation, and a concurrent scale nomogram for this is shown on the right.
The derivation is somewhat involved, but in the end the scaling factors m must meet the following conditions:
m1 = m2 = m3 / (2 cos A)
where A is the angle between the u-scale and the v-scale, 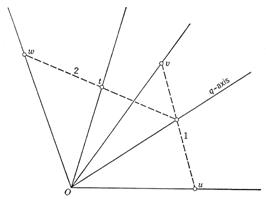 and also the angle between the v-scale and the w-scale. The scaling factor m3 corresponds to the w-scale. The zeros of the scales must meet at the vertex. If the angle A is chosen to be 60°, then 2 cos A = 1 and the three scaling factors are identical, as is the case in this figure.
To solve the 4-variable equation 1/f1(u) + 1/f2(v) + 1/f4(t) = 1/f3( w), the equation is first re-arranged as 1/f1(u) + 1/f2(v) = 1/f3( w) – 1/f4(t). Then the two halves are set equal to an intermediate value f(q). A compound concurrent chart is then created in a similar way to other compound charts as shown in this figure (here A is chosen to be less than 60°).
4-Variable Charts
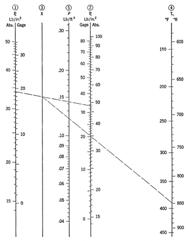 A 4-variable equation with one unknown can be represented as a combination of two separate charts of any type. The first step is to break the equation into two parts in three variables that are equal to one another. For f1(u) + f2(v) + f3( w) = f4(t) and t unknown, we can re-arrange the equation into f1(u) + f2(v) = f4(t) – f3( w) and create a new variable k to equal this sum. Then a blank scale for k is created such that a parallel scale nomogram for f1(u) + f2(v) = k marks a pivot point on the k-scale, then a second straightedge alignment from this point is used for a parallel-scale nomogram for f4(t) – f3( w) = k to find f4(t). The scaling for u, v and w and the position chosen for the k-scale can be optimized to minimize errors at the pivot point for small errors in the straightedge alignment. The figure on the right shows a compound parallel scale nomogram. Below are examples from Levens of compound nomograms of Z charts and concurrent and proportional charts. A key often provides instructions on the use of a compound nomogram as shown in the first figure. Of course, this concept can be extended to equations with additional variables, where color coding would be helpful.
Curved Scale Charts
It is possible to geometrically derive relationships for nomograms that have one or more curved scales, but the design of these more complicated nomograms is so much easier using determinants. Designing nomograms with determinants is the subject of Part II of this essay.
>>> Go to Part II of this essay
Printer-friendly PDF of Nomography Parts I-III.

I have chanced upon your web site while looking for background on the method of operators. Your essay on Heaviside was superb, but I have enjoyed even more your work on nomograms. I recall with fondness — and a bit of alarm that at 46 I may be old after all — being introduced to all sorts of nomograms as a undergraduate student of civil engineering. I may have been part of the last class to be required to prepare technical drawings by hand, and use nomograms!
One thing I noticed was one of synonyms for nomograms, abacs. I am an occasional collector of French textbooks on groundwater. More precisely, I collect groundwater textbooks, and some of my favorites are in French. It has always puzzled me why design charts in these textbooks are referred to as “abaques”. Now I know why.
Thank you for your wonderful website.
Your welcome! I appreciate your thoughtful comments. — Ron
LikeLike
Joy of joys. I recall encountering books on the theory of nomographs as an undergraduate hardly imagining that such works would become obsolete. So easy to take for granted when still in an engineering office, but try finding parallel resistor graphic-calculator in the bww. Several years ago when 1st dabbling with www it must have been one of the first things I searched for and I think my efforts were poorly rewarded.
So many thanks for taking time out for creating the site: I suggest the www-hierarchy should introduce “Hilaire Beloc Awards” – I nominate you for a gold
Thanks, Graham! When I started looking for information on nomography last December I was also surprised at how little information about the subject was available on the web, while there are certainly many websites on slide rules and the history of computing. I’m really gratified by responses on this topic that I’ve received by people such as yourself.
I read the Belloc quote ten years ago in a footnote of a sundial article by Fred Sawyer and I wrote it down because I liked it so much. Fred is now the President of the North American Sundial Society, and recently while I was looking up something on sundials for an essay I saw that he presents that same quote in the “About NASS” page of the NASS website, so I hope I’m not appropriating something out of turn. In any event, if there were such an award I’d nominate Fred for the incredible work he’s done over the years in preserving and extending the aesthetics and mathematics of sundials. — Ron
LikeLike
Interesado en saber como construir esas graficas.
Lo leere antentamente.
LikeLike
Nomograms were the norm in EE also. I’m 46 as well and also notice I was the last generation to use nomograms, slide rules and such. I was the last EE class at my university to do programming with punch cards as well.
The Smith Chart at the top of the article is a nomogram I’ve used extensively. What’s absolutely fascinating about it is that the circular patterns are a particular type of transform called a conformal map, specifically the Smith Chart is a Moebius transform, one of the most fundamental conformal maps known in nature. Specifically: Gamma = (Z-Zo)/(Z+Zo) where all variables are complex. A perhaps more familiar conformal map is Z^2+C which is the generating function for a Mandelbrot/Julia set.
The Smith Chart specifically is a transform between the two major model spaces used by EEs: the space of lumped equivalent devices which includes resistors, capacitors and inductors and the space of distributed transmission lines which describes the realm of RF and Microwave circuits and systems. Every point on the interior curvy space represents a complex lumped impedance Z = R+jX, while the circumferential scales represents the equivalent phase delay on a transmission line, and the scalings on the bottom represent various equivalent forms of reflected power ratios.
Everything in the Smith Chart can be done trivially using complex algebra and a handful of equations but even though all that can be done with a slide rule even, the Smith Chart nomogram is faster and offers an intuitive model for what’s happening physically. Today’s microwave instruments still optionally display impedances measured using a Smith Chart graticule drawn on the screen – the nomographic scales are omitted however leaving only the Moebius transform itself. You can determine all sorts of stuff from such data displayed on a Smith Chart up to things like stability and match of a nonlinear device like a transistor amplifer simply by plottings its input impedance on a Smith Chart parametrically over frequency. (The pdf link describes all Smith charts and transmission lines more practically, the jpg is one of Agilent latest mm-wave analyzers – the photo sucks but the circular things on screen are Smith Charts – BTW I don’t work for Agilent but I used to work for HP and I still use Agilent products but also other companies’ also)
Click to access 5965-7917E.pdf
I also collect old text books but of old or vintage electrical engineering (generally 1950s or earlier with favorites being 1910-1950 for vacuum tubes and prior to 1920 for crazy stuff like arc converters, spark gaps and such). These are full of nomograms as well, though none as elegant as the Smith Chart generally.
BTW the formality of modern EE (with standardization circuit analysis techniques, etc.) occurred in the mid-1930s. I know because I have a copy of pretty much every EE text book written in English from the first half of the 20th century. The prime mover was none of than Dr. Fred Terman who authored the first EE text book in 1933 which codified it all as we see it in today’s EE textbooks. Fred Terman was Bill Hewlett and Dave Packard’s mentor/advisor at Stanford and inventor of the Silicon Valley entrepreneurial business model though for reasons most people have no idea about (see YouTube Google talk link – very interesting). The back entrance to Agilent, nee HP T&M, corporate headquarters off Lawrence Expressway south in Santa Clara is called Terman Lane – named after the same.
http://en.wikipedia.org/wiki/Frederick_Terman
What folks today don’t seem to understand about those days is that today we have a false confidence in precision. Most of that resolution computers deliver doesn’t actually buy you as much as some today think it does. Most electrical measuring instruments, for example, are still limited by the total accuracy and resolution defined by the accuracy components like resistors which have only crept up to 3.5-4 digits even today from the 2-3 digits in the days of slide rules. You can be tricked by the instrument specifications if you look at them superficially.
There is a semiconductor analyzer family I use that operates from “20 fA to 2A” on the datasheet (“14 orders of magnitude! Wow! Gee, look progress! We’re good!”). But if you look closer it’s covering this range best-case by only 3.5 digits at a time by using automatic ranging. Like an automatic transmission in a car extends the total speed from 0 to 200 kph using only a narrow range of RPM values. So no individual measurement is actually better than 3.5 digits and more often is less (3.5 digits is at “long integration” which most folks find impossibly slow taking ~1 second per point). It’s possible to use timing accuracy, bandwidth control and feedback to go beyond 4 digits in one shot for a few, very specific measurements but not generally for any arbitrary type of measurement. Most stuff ranges narrowly like the above example.
Back in the days of nomograms and slide rules, the economies of calculations were such that you needed to be more aware of these limitations because it could mean the difference between hours and days of calculation time. The 2-3 digits of resolution you get from nomograms and slide rules was/is often enough to get the job done since that was what the accuracy of measurement was also. Exceeding the resolution beyond the accuracy *excessively* is simply garbage-in-garbage-out when it comes to end result accuracy but when computation gets cheap it’s too easy to ignore that. People today often think “the answer” really is all the digits in an IEEE 754 floating point number!! More often than not it should only be 2-4 digits based on the calculations and underlying measurement data.
==========
Wow, thank you for your comments, Jes–it was really fascinating reading. Although I’m a bit older than you, my fields were math and physics so I had seen the Smith Chart but virtually never used it. Another reader of this essay emailed me awhile back about a website collection of Smith Chart resources at http://www.sss-mag.com/smith.html. The presentation by Stephen D. Stearns (“Mysteries of the Smith Chart” at http://www.fars.k6ya.org/docs/smith_chart.pdf) was particularly recommended by him, and I think it’s just great.
I agree with you about false confidence in multi-digit answers. Another thing that occurs to me about nomograms, including the Smith Chart, is that since you are taking just one or two readings to solve what could be a very complicated formula, your final answer does not have accumulated errors from individual readings or calculations, so the final answer really does have the advertised accuracy regardless of the complexity of the formula.
So thanks again for taking the time to write about all of this. Feel free to write more, and if you have any interest at all in writing a short essay on arc converters or spark gaps or anything else along these lines, I’d be thrilled to include it here on the blog! — Ron
LikeLike
Excellent presentation on nomographs! These can still be as useful today as they were in decades past; I’ll be constructing some for a document I’m working on. What those of us who went to school in the 60’s and before appreciate are 1) the speed of getting an answer (two significant figures is often good enough) and 2) no need to do a calculation to get a number. I still remember the drudgery of having to do calculations using log and trig tables because the accuracy required was a little bit beyond what a slide rule could deliver. The first time I saw the HP-35 is burned into my memory as strongly as Kennedy’s assassination or the uproar when Sputnik was launched.
It’s good to hear people are still designing these graphical calculators. I’m incorporating nomograms into some of my page designs for my Plans Unfolding paper organizer, such the one here (click on the image to see a high-res version).
Regarding tables, I’m working on my next essay on the making of logarithmic tables, and the drudgery of using such tables is all coming back to me. Even though the topic is not really on how to use the resulting tables, the biggest challenge is writing an essay on the excruciating tedium of their creation without writing a tedious essay. And I also remember the first time I saw an electronic calculator–my high school English teacher brought one in one day and showed it to all of us. It took another year or so for me to get one, and another year of tables and slide rules before I got one with logs and trig functions on it. As for Sputnik, that was four days after I was born and I probably had other things on my mind. — Ron
LikeLike
I have been scouring the internet for a reference to Nomograms for nearly 10 years (I had forgotten their name). I was introduced to them (many) years ago, and have been semi-actively trying to find out the name and structure of them – wonderful, nearly in tears after many years….. thankyou.
Thanks for your comment, Chris! I really knew very little about nomograms when I started gathering references, and I was stunned by what I found. Since I’ve accumulated a lot of articles and books on nomography, I’m now planning on writing a blog essay that will just be a showcase of scans of the coolest nomograms I’ve run across. There are many that are a lot more inspirational than the simpler examples in my essays, and it would be a fun and easy article to write after I finish the one I’m working on now.
Nomography is an actively growing topic on the web. Sites on nomograms that have recently been updated include William Chung’s site, Leif Roschier’s Pynomo site with free software to generate nomograms (see the “Basics” and “Examples” links or the links under the Software Documentation area to see beautiful examples), and Eric Sumner’s newly-launched site. And there is the relatively young nomography forum as well for ongoing discussions. — Ron
LikeLike
Hi,
I was very interested to find your essay. About 8 years ago I was trying to find out about the design of nomograms, and could find precious little on the subject. Nomograms are fantastically useful for an instant calculation or assessment, without having to turn on a computer first – great for any ‘in the field’ application.
I was trying to design something for risk assessment, extending an idea that had been used, I believe, by the US military and then modified by the New Zealand authorities for the purposes of the assessment of risk of injury from defects with consumer products. I wanted to extend it for the risk assessment of food, to assign suitable frequencies of sampling for analysis to detect problems for consumer protection/safety.
With not even the slightest concept of appropriate mathematical relationships, and being unable to find anything to help, I approached this entirely non-mathematically. In the end my design was based on trial and error with practical experimentation. Once I had gone beyond the New Zealand basics I struggled a lot to get the model to do what was needed, until hitting on the idea of non-parallel axes, when all of a sudden it started to come together. Had I seen your essay first it may have prompted me down that line much earlier!
What I’d be interested to know is how to extract formulae that effectively lie behind the nomogram – I’m not a mathematician, and whilst I might get there sometime the methodology has eluded me so far! Extraction of the formulae would enable a calculation of risk to be done on a computer, which unlike the nomogram would then lend itself to multiple rapid assessments.
In case you are interested in the risk assessment nomogram, there are a pair of documents on www publicanalyst dot com /News/Historical_Documents/ Risk_Based_Sampling_Vol_1.pdf and Risk_Based_Sampling_Vol_2.pdf
I’ve read through your papers and I’m impressed with your success with empirical nomography! The creation of nomograms from empirical data is sometimes covered in books, but I understand that you are looking for the reverse–to find the equations from nomograms. The only thing I’ve seen on that is the paper http://eldredgeengineering.com/Reverse%20Engineering%20Nomographs%20Paper.pdf but the author’s approach is definitely ad hoc–he knows the form of the engineering equations and he has a nomogram that has a grid that can easily be separated into x and y components. The general method seems to be curve fitting based on the expected form of the equation from the configurations of the scales. I had a quick go at deriving something from your risk assessment nomogram but the equation got very complicated very quickly, to the point that it would not be useful. If you only assumed discrete values on some scales as it appears in your papers, it would make such a curve fit much simpler, I would think. — Ron
LikeLike
Ron,
I’ve only just started reading the PDF form of these three nomogram posts, and I’m very glad to see them! I wish they were there half-a-decade ago when I wanted to make some simple parts-calculators for op-am circuits!
I do have one minor quibble: “It’s interesting to note that the nomogram has outlived the slide rule.” This is not so! Just as nomograms take many forms, so do slide rules. I know of one company which markets a (very cheaply made and in accurate) wooden slide rule as a promotional, “your logo printed on the back” deal, but also the Concise company makes and still sells very fine circular slide rules. There are other companies making both slide charts (cardboard sliderules, sometimes ruled and sometimes just with selection text on them) and slide rules (one company is selling ruled slide charts and slide rules specific to the medical industry.) So don’t count them out, yet!
One other aspect: it is likely that many people have used nomograms without knowing. In addition to the more obvious cases where the word “nomogram” is not used to describe them, the operation of some nomograms just don’t seem to fit the bill. I was a bit surprised to see the venerable Smith chart presented as the first of your nomogram examples, simply because we never used them like a nomogram, per se. Instead of laying a straight edge across two variables to get a calculated answer from a third line or some such, we simply plotted measurements involving phase and amplitude as frequency varied, then drew lines to connect the dots and analyzed the resulting figure to understand the RF system! It is a way of considering the nomogram which adds a few more dimensions to its fascination!
Hi Ray. I just looked up the Concise company. You’re right, they do sell circular slide rules—I had no idea. I still have my pocket circular slide rule from my high school days,so I’m partial to those. I’m not surprised as much by companies making custom cardboard slide rules for specific products. (I plan on writing an essay on designing custom slide rules at some point, BTW.) I will have to modify my statement so that it doesn’t imply the death of slide rules. But the use of nomograms, particularly in the medical field, is not uncommon today, so I think it’s fair to say that the use of nomograms surpasses that of slide rules today.
The Smith Chart has a multitude of uses, some of which involve lines as well as the curves. On viewgraphs 35 and 36 of this presentation there is a brief description of its use to calculate squares and square roots, as well as tangents, cotangents and their inverses. Not that I’ve ever done that—my limited background with this chart is as you describe.
Thanks for the information, Ray. In addition to this initial 3-part essay, there are two other articles on nomography here, and more are coming. You will find that the figures are sharper in the PDF versions. Meanwhile, you might visit the Pynomo site for nomogram software to see some very impressive nomograms. You can find them under the Basics link, the Examples link, and the Type links under the Software Documentation link. Another site with good examples is found here. — Ron
LikeLike
I wanted all formulas & identities . Your information was very help full for me.Thanks!!!!!!!!!!
LikeLike
nice!
LikeLike
Hi Ron,
I enjoyed reading your essay on nomography. I feel like I’m a reasonably smart guy, but it certainly baffled me to imagine making one of these myself. I have used nomograms in the past in the Navy for determining amounts of chemicals to add to boiler water to achieve a specific pH, as well as for ship navigation, but I’m interested in creating my own. It may take me some time to work my way through the process, but my goal is to make a nomogram that allows you to determine the azimuth (bearing around the horizon, 0 is north, 180 is south) of a star when it rises or sets from the declination of the star (angle above or below the celestial equator – Earth’s equator projected out into space) as well as your latitude. Turns out that cos(azi) = sin(dec)/cos(lat). I am curious about this because I’m trying to teach myself a modern day version of the Polynesian method of navigating long distances without instruments. Turns out that near the equator, where cos(lat) ~ 1, so azimuth = arccos(sin(dec)), and a star’s declination is effectively constant within any man’s lifetime. So Polynesians could afford to memorize the rising and setting azimuths of stars, although they even managed to voyage as far south as New Zealand with their methods. I would like to make a nomogram that would especially allow you to determine the latitude from the azimuth and declination, which you would use when you recognized the star that was setting. Then you could apply this method even to arctic or antarctice navigating. I think the information in your essay will allow me to do that. Thanks so much!
Hi Adam. Nomograms for celestial navigation and calculation go back to D’Ocagne’s treatise, with more provided in Soreau’s books on nomography. Since your situation with the rising/setting of a star means the altitude is zero, you have a simpler situation than usual, and you can use several different forms of nomogram from three parallel lines, N-chart, etc. I sent some information on general celestial nomograms to you by private email, and I’m trying to gather more. I’ll send it as soon as I can locate it. — Ron
LikeLike
Thank’s a lot for this articles. It’s something new for me.
All the best for You from Belgrade, Serbia (part of ex Yugoslavia).
Dule Markovic
You’re welcome, Dule! — Ron
LikeLike
A rich source, you need to subscribe or use a library service, is JSTOR, Journal of the Royal Statistical Society, Series C. I just downloaded about 50 PDF articles, nearly anything you want going back to 1918 or earlier.
LikeLike
A potentially very useful program for drawing nomograms is Asymptote. It has a graphing submodule which includes a tool for placing tick marks along arbitrary curves. http://asymptote.sourceforge.net
Having a pathologically critical mind set, I could not help but noticing a large number of “here” links. They make up one possible area for improvement (see e.g. http://www.w3.org/QA/Tips/noClickHere).
Far too often, people think “old = bad, new = good”. Nomograms may be arcane, but definitly not useless! BTW, I still use a slide rule occasionally…
Thanks, Johannes. I hadn’t heard of Asymptote before, and it looks great! I’ve used TikZ quite a bit for graphics, which also runs within LaTeX, but TikZ uses the LaTeX counters and lengths for variables and it takes a lot of trial and error to keep them from overflowing. Asymptote is a full language with floating point support, which is fantastic for drawing mathematical figures. PyNomo is my choice by far for drawing nomograms, but I will certainly be using Asymptote for other mathematical drawings (and animations!).
I read the webpage on formatting links. I had never thought about it before. I’ll be updating this essay soon to fix a few small things, so I’ll update the link format—I’m also someone who cares about these details. — Ron
LikeLike
Secondary Ports height of tide and relationship to a Standard Port High and Low Water use a nomogram too. Any feedback on this aspect is welcomed please!
I wasn’t aware of this, but it makes sense. I’ve tried to find references on this since you posted your comment, but the ones I’ve found that use the word “nomogram” are actually standard graphs. Apparently, storm surges lend themselves to graphical analysis, but again I haven’t found any good nomographic examples yet. Nomograms based on measurements, empirical nomograms, can be created from the data, and I suspect some of the tidal nomograms for secondary ports may be derived from measurements while storm surges rely on modeling equations. I’ve been meaning to write an essay on creating empirical nomograms, so I will someday. Meanwhile, if anyone finds examples of tidal nomograms, please let us know! Thanks, David. — Ron
LikeLike
Dear Ron
I came across “The Art of Nomography” by chance, and am hooked! Many thanks for such a clear and comprehensive introduction to such a fascinating subject. I have been inspired to buy two of the books that you recommended (Hoelscher’s “Graphic Aids in Engineering Computation”, and Leven’s “Nomography” – both highly recommended for a beginner like myself), and have constructed several parallel alignment chart nomograms which work well.
I now want to make a compact and easy to use graphic aid to compute the results of a fairly complex 4 variable actuarial equation.
I want to find p where:
p = (100 * ( e^z /( 1+ e^z))
where: z = -9.7 + (0.086 * u) + (0.18 * v) + (0.061 * w)
u, v and w are entered by the user. e is Euler’s number= 2.718.
Ranges are: p (0 -100), u (0 – 100), v (0 – 100), w (16 – 100)
If possible, I’d like to do this using a nomogram which avoids the need for an ungraduated “pivot” axis to make things simpler for the user. Alternatively, I could use a moving scale nomogram (i.e. bespoke slide rule, as per Hoelscher, chapter 6) if this would result in an easier to use or more compact solution.
I’d be very grateful for your advice as to which approach and type of nomogram (or slide rule) I should use.
Feel free to contact me via the blog or directly via email.
Many thanks in anticipation
Dave
Swansea, UK
Wow, that’s great that you got into nomography like this! It really makes my day, actually. As you no doubt have found, you can express this equation in the form f1(p) + f2(u) + f3(v) + f4(w) = 0, so it comes down to whether you have to have a compound nomogram for the sum of 4 functions of the variables. Normally, a compound nomogram is what you see drawn for this. Sometimes you can express a 4-variable equation as a 2×2 grid and two other scales and use just a single isopleth, but in this case I’m still evaluating whether that can be done. At the very least, it should be possible to have two 2×2 grids and one other scale, where one of the variables appears on two grids. And as you say, you can create a special slide rule with a single position that relates to a set of values for the variables, but then you have to make the slide rule. However, I’m still looking at your equation and its determinant equation equivalent, and I’ll send you an email on it and we’ll discuss it. This is exactly the kind of puzzle I enjoy. — Ron
LikeLike
Excellent article. Your posts set a very high standard for bloggers. Like many others have noted I was exposed to nomograms in my wasted youth and always felt that something important was lost when these elegant little analogues started disappearing.
Thank you! As I mentioned somewhere else, I somehow never encountered any nomograms until the late 90’s when I saw simple versions of them in a couple of articles on sundials. When I eventually started researching them several years later for these essays, I was blown away with what I found. I still collect articles and books on nomograms, and I have many more interesting ones to share in future essays. I’m also actively involved in creating new nomograms for projects and journal articles, so my interest has only increased in these things. Thanks again for your nice comments, John. — Ron
LikeLike
Hi Ron
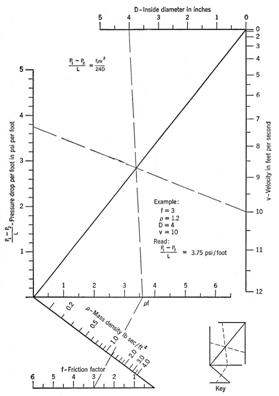
Over the years searching for ways to do nomographs I have never come across to an article as excellent as this one. As part of my daily work I work on a particular nomograph almost every day and I have been looking for a way to execute my work without ever reading this nomograph but to no avail (see link below).
https://docs.google.com/open?id=0B-UXy3wQpIlXNTNhMjI2NjQtNjY5OS00MTAwLWI0NGItMDE3MDMyYThmZTI5
To read the nomograph you need the diameter and internal pressure to obtain plate depth.
Your assistance will be appreciated.
Regards
Tshepo
For others who might be interested in this subject, I sent Tshepo a write-up including a derivation and a Python script for calculating the results of the nomogram quite accurately over the tests I ran against it. Swanson provides the sequence of equations he used for designing his initial range from 100 to 600 psi, but there are significant differences outside this range that required measurements off the nomogram and equations curve-fitted to the data. The two of have just started to look at this, but if you are interested in getting the current preliminary version, feel free to email me at ron “at” myreckonings.com — Ron
LikeLike
Hi Ron,
We may have met at one point in the last 20 years. I am a member of the North American Sundial Society and attend their annual conference when possible. It would be a rare year if nomography was not mentioned during a conference. At one point this year in Asheville, Fred Sawyer talked about nomography being a solution for navigators. While at sea, navigators did not have three days of time to do the math required to solve the various “where are we” problems. Nomography aided solutions to that problem.
That time restraint for navigators is not unlike the average Joe that wants to understand their retirement. Who has the hours and education level to create wise 401 retirement programs? Last summer I tried to grasp the significant factors effecting pension systems in Illinois. I found that employee contributions, employer (state) contributions, assumed rate of inflation, assumed rate of return, and the time line of events in that problem really point to the rate of return and compounding as most significant. If I didn’t have 7-8 balls in the air right now, I would like to work on a nomograph of the problem.
If anyone reading this wants to tackle the time value of money nomograph for Congress, they and/or their aides could sure use some help right about now.
Thank you for sharing your work. It is appreciated.
Warren Thom
Just a note for others here that I’ve followed up with Warren by email. I’ve known of Warren and Fred for years because of their work on sundials, a long interest of mine, and in fact I met Warren (and Fred) at the 1997 NASS conference in Chicago. There’s a 1997 conference proceedings paper on the NASS website that has pictures of both Warren and me. In fact, the first time I ever saw a nomogram was in a sundial article by Fred way back around that time, and I made a mental note to learn about them, which I finally did nearly 10 years later when I launched this blog. Lately I’ve been working on a sundial that incorporates two nomograms. Also, I’ve been collecting articles on nomograms for astronomy and celestial navigation for a few years, and I’ll be posting some on that here. The calendar I’ve been making for 2013, which is now postponed into a 2014 calendar, has the theme of old graphical calculators in astronomy. — Ron
LikeLike
Thank you very much for this very useful and interesting paper on nomograms.
LikeLike
Nomographs are great. I’ve been collecting them for 20 or 30 years. Have a thick notebook on them. Even came across a book in a used book store that shows how to make them. If you think that a nomograph is unsatisfactorily inaccurate then you don’t realize the actual inaccuracies in the underlying calculations, assumptions, measurements, or data you are using on a daily basis. Data from text books, online or wikipedia is unsupported heresay. Unless you get from a reliable source such as the NIST, NASA, DOD, etc. Text books generally relate back to single sources some 50 years ago. For instance like in heat transfer to McAdams. They all quote the same figures but they are 60 years old. All engineering involves judgement. Rounding down or up as appropriate or conservative. Same is true of nomographs. We went to the moon on slide rules and 64k of memory for the guidance system. Delusions of accuracy with computer or calculator’s many decimal places is a forgetfulness of the basic concepts taught in 1st and 2nd year college of significant figures and how they are lost during chain calculations! ……ficticious confidence in fallacious figures.
LikeLike
P.S. The largest source of error is not in the computer programming processing, calculations, or engineering, but in the input data, which generally has a large margin or error.
LikeLike
Love the posting. I’m currently delving around in nomography as part of a small project to identify practical ways of getting good initial estimates to solutions of nonlinear equations. Initial experiments seem to show that getting a good starting point is the most effective single means of reducing the computation involved in iterative solutions. Strangely, however, this topic has been almost completely ignored in textbooks on numerical methods, even those from the early days of electronic computation.
I’m also toying with the idea of doing a new and annotated translation of d’Ocagne’s Traite de Nomographie … but that’s a long way off until more pressing things are out of the way.
LikeLike
I was inspired by a recent discussion with some (older) colleagues to develop my own quite simple nomogram: https://figshare.com/articles/Nomogram_for_the_rock_PGA_GMPE_of_Ambraseys_et_al_1996_/7111535 using the technique given on this webpage. Thanks for an interesting and useful read.
LikeLike
I’d like to mention Nomographer channel on youtube. https://www.youtube.com/channel/UCOLYtsL4ge6QfaAvBDeG1IA
LikeLike