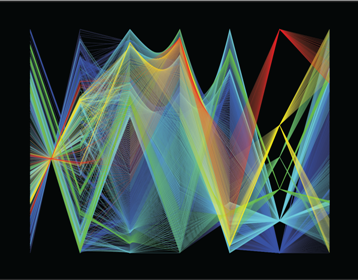
 I am happy to announce Sliver, a free software application I wrote over the last two years for multivariate data visualization. Sliver includes parallel coordinate (PC) plots, PC plot matrices, various types of configurable 2D and 3D scatterplots, and plots overlaid on Google Earth, all fully linked by color brushing. Transparency (alpha blending) is supported as seen at left. Sliver also offers data animation, including Google Earth animation as well as the Grand Tour, a rotation through n-space that reveals correlations and structures in multidimensional data. Have a look!
This modern application may seem at odds with the theme of my blog, but in fact it was Maurice d’Ocagne who coined the term parallel coordinates in regard to his parallel scale nomograms. A hundred years later Alfred Inselberg extended this idea of parallel scales as a way of visually analyzing multi-dimensional data. Inselberg and others make use of some of d’Ocagne’s work on point-line duality to characterize functional relationships between variables as structures and envelopes of the lines drawn between their axes.
