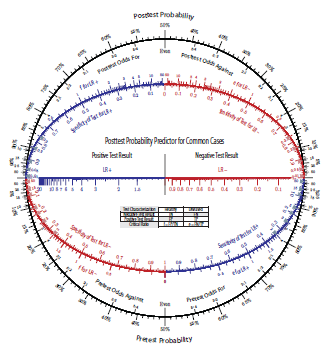
 Last month Joe Marasco, Leif Roschier and I published an article on Bayes’ Theorem in The UMAP Journal that included a foldout of large circular nomograms for calculating the results from it. The article, Doc, What Are My Chances?, can be freely downloaded from the Modern Nomograms webpage, which also offers commercial posters of the two nomograms used to calculate Bayes’ Theorem (one for common cases and one optimized for calculating rare cases).
nomography
New Modern Nomograms Website
 I want to announce that my fellow collaborators in nomography, Joe Marasco and Leif Roschier, and I have a new website called Modern Nomograms to offer posters of new nomograms that we hope will interest people. Our initial posters are nomograms for calculating results from Bayes’ Theorem as described in the next post here, but we expect more will follow.
This project does not in any way affect the content here—essays will continue to be written as usual on lost arts in the mathematical sciences, including nomography. This is simply an outlet to provide an option for nomograms in poster form.
Book Review: The History and Development of Nomography, by H.A. Evesham
 Those of us who enjoy our expeditions through the lost world of nomography quickly discover that many original sources that are still considered masterpieces in the field have never been translated into English. In my case this is a serious handicap, and I find myself struggling through the texts trying to understand the rationale behind the beautiful nomograms I see on the printed page. Nomography and its predecessors were invented in France and only later spread to such places as Germany, the U.S, Britain, Russia and Poland. Today it seems to me that most research appears in Czech journals. In addition to the language difficulties, many of the original sources are in obscure, hard-to-find journals.
In 1982 H.A. Evesham produced his doctoral thesis, a review of the important discoveries in nomography. It is often cited in other works, but unless you know someone who knows someone, it is very difficult to find—I have never been able to locate a copy. However, just recently Mr. Evesham’s thesis has been professionally typeset and released as a book (click here or here) by Docent Press under the aegis of Scott Guthery. If you have an interest in the theoretical aspects of nomography beyond the basic construction techniques of most books and of my earlier essays, you will appreciate this book as much as I do. Mr. Evesham does a wonderful job of weaving mathematical discoveries in nomography from many contributors into a readable but scholarly work.
Lallemand’s L’Abaque Triomphe, Hexagonal Charts, and Triangular Coordinate Systems (Part II)
 Part I of this essay described and analyzed Charles Lallemand’s L’Abaque Triomphe, the first published example of a graphical computer called a hexagonal chart. Here we discuss the mathematical principles behind hexagonal charts and provide examples of these charts from the literature of the time. The related development of triangular coordinate systems is also covered in this second part. Trilinear diagrams, a simpler offshoot of triangular coordinate systems, are still seen today in fields such as geology, physical chemistry and metallurgy (as shown to the left). A list of references is provided as well. A printer-friendly Word/PDF version with more detailed images is linked at the end, with a hexagonal overlay in the appendix that can be used to exercise these charts.
Lallemand’s L’Abaque Triomphe, Hexagonal Charts, and Triangular Coordinate Systems (Part I)
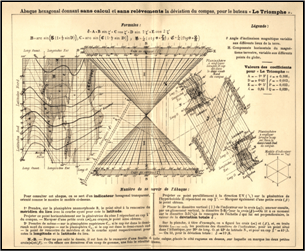 In 1885, Charles Lallemand, director general of the geodetic measurement of altitudes throughout France, published a graphical calculator for determining compass course corrections for the ship, Le Triomphe. It is a stunning piece of work, combining measured values of magnetic variation around the world with eight magnetic parameters of the ship also measured experimentally, all into a very complicated formula for magnetic deviation calculable with a single diagram plus a transparent overlay. This chart has appeared in a number of works as an archetype of graphic design (e.g., The Handbook of Data Visualization) or as the quintessential example of a little-known graphical technique that preceded and influenced d’Ocagne’s invention of nomograms—the hexagonal chart invented by Lallemand himself. Here we will have a look at the use and design of this interesting piece of mathematics history, as well as its natural extension to graphical calculators based on triangular coordinate systems. Part I of this essay covers Lallemand’s L’Abaque Triomphe, while Part II covers the general theory of hexagonal charts and triangular coordinate systems. A printer-friendly Word/PDF version with more detailed images is linked at the end of the essay.
Nomography Article in the UMAP Journal
 Last summer a fellow nomography enthusiast and friend, Joe Marasco, e-troduced me to the editor of the Undergraduate Mathematics and Its Applications (UMAP) Journal, with the idea of submitting my original 3-part nomography essay on this blog for publication. The experience I’ve had on this project with Paul Campbell, a professor at Beloit College and the editor of the journal, has been superb. In addition to his enthusiastic support on the article, he invited me to give talks on nomography and sundials at the college, which I thoroughly enjoyed doing last September.
The article, a significantly revised version of my blog essay, has now been published in the UMAP Journal, and per the standard agreement I can post the PDF of the article here for anyone to download. More information and a link to the article are below.
A 2010 “Graphical Computing” Calendar
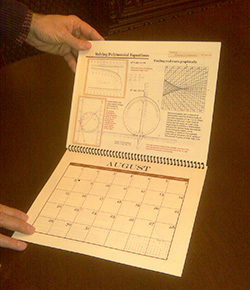 As you may have noticed, the history of graphical computing (nomograms and the like) has become one of the major themes of this blog. I did not foresee this, as I knew virtually nothing about the subject before I started researching my first essays on nomography a couple of years ago. This topic is still one of my main pursuits, and I’m as astonished by what I find now as I was back then. To capture a bit of this spirit, I’ve created a free 2010 calendar titled The Age of Graphical Computing that is available for downloading and printing. The fun thing is that you can test the examples right on the calendar to show that they work!
Creating Nomograms with the PyNomo Software
 Are you intrigued by nomograms but have no idea how to go about drawing them? PyNomo is an amazing, free software package for drawing precision nomograms. The output is in vector form in a PDF or EPS file, so it can be printed in any size and still retain its sharpness. PyNomo directly supports 9 basic types of nomograms based simply on the format of the equation, so for these types there is no need to convert the equation to the standard nomographic determinant or use geometric relations. But it also supports compound nomograms as well as more complicated equations that have been cast into general determinant form, so it can produce output for any equation that can be plotted as a nomogram.
Magnetic Deviation: Comprehension, Compensation and Computation (Part II)
 William Thomson called them “beautiful and ingenious geometrical constructions,” and in variance to their rather humdrum name dygograms are certainly charming to the eye. But these geometric constructions can conveniently generate and then calculate the magnetic deviation of a ship compass at a location.
With our electronic calculators and computers, we take for granted the effortless arithmetic and trigonometric calculations that so vexed our ancestors. Pre-calculated tables for roots and circular functions, generated through hard work, were often used to create tables of magnetic deviations for specific ships and locations. To reduce the chance of misreading these tables, a few types of graphical diagrams, not just dygograms, were invented to provide fast and accurate readings of magnetic deviation. These graphical calculators are the focus of this part of the essay.
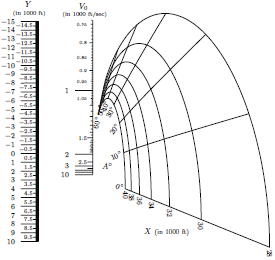
A 4-Variable Nomogram — 四变量诺模图

by Liunian Li 李留念 and Ron Doerfler
Designing a nomogram for an equation containing more than three variables is difficult. The most common nomogram of this sort implements pivot points, requiring the user to create a series of isopleths to arrive at the solution. In this guest essay, Liunian Li describes the ingenious design of a nomogram that requires just a single isopleth to solve a 4-variable equation.
